Race review for official iRacing races

GapTrace

A lap-by-lap breakdown of one of your official iRacing races: gap to the class winner, class position every lap, pace against the cars you raced. Plus what each pit stop cost.

1 clickper race, from iRacing results
0cookies
0analytics
0databases storing your data
0uploads of your .ibt file

Load a race

Works in Chrome on a computer.

Install once
Chrome extensionFor Chrome

Adds an Analyze race button next to Share Results on iRacing results pages.

In Chrome Web Store reviewAvailable here once Google approves it.

The sample runs on a generated race, so you can read the whole report before installing anything.

Runs only on members-ng.iracing.com · requests no browser permissions · reads only the race you open · race data is not sent to any server. Privacy

Then, for each race
  1. 1Go to Results on members-ng.iracing.com and open a race.
  2. 2Click Analyze race.
  3. 3The analysis opens in a new tab.
Button not showing?
  • Reload the results page. The extension only runs on pages opened after it was installed.
  • Open one race, not the results list. The button appears on a single session's results page — the address bar will contain subsessionid.
  • Check the address. It works on members-ng.iracing.com only; the older members site has no button.
  • Look at the bottom right. If iRacing moves its results toolbar, GapTrace puts Analyze race there instead and marks its toolbar icon with an exclamation mark.
  • Nothing opens when you click it? Allow pop-ups for members-ng.iracing.com.
  • Still stuck? Send the race link and it gets looked at.
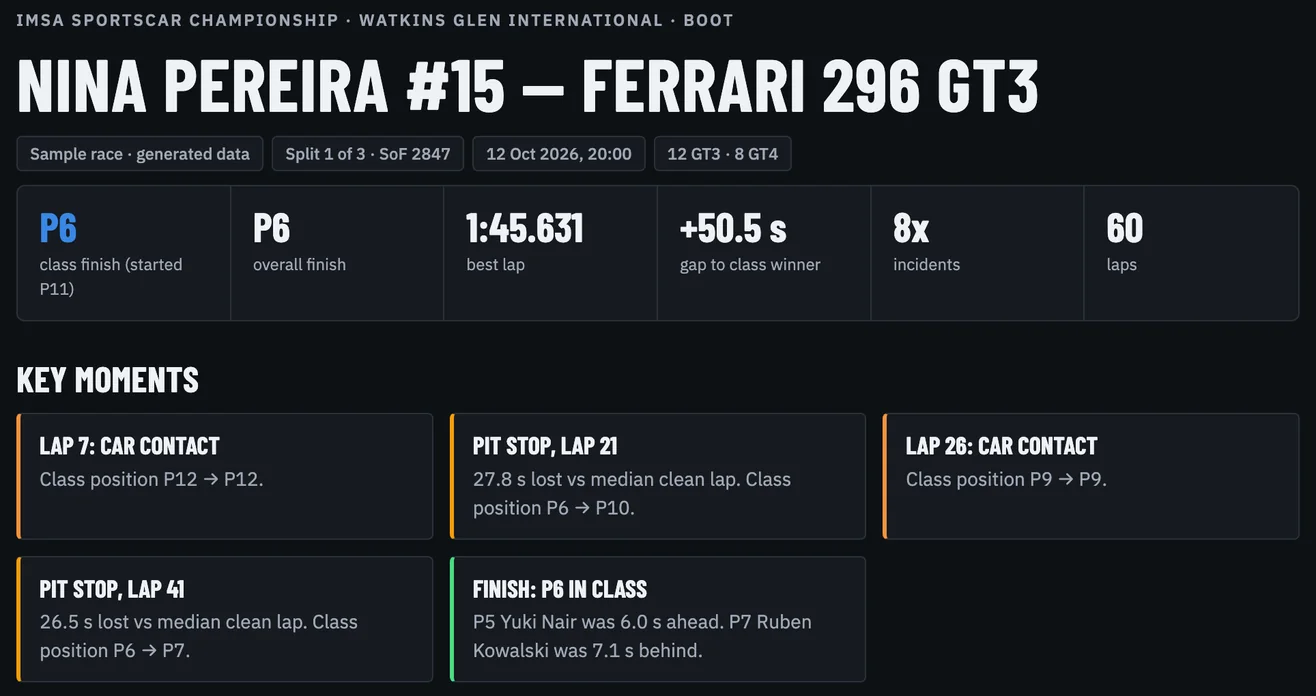
Top of the sample analysis: IMSA Sportscar Championship at Watkins Glen, Ferrari 296 GT3. P6 class finish from P11, P6 overall, best lap 1:45.631, 50.5 seconds behind the class winner, 8x incidents, 60 laps. Key moments: contacts on laps 7 and 26, pit stops on laps 21 and 41 with roughly 27 seconds lost each, and the finish in P6.
What you get. Result strip and key moments, from the sample race. Each pit stop shows the seconds lost against a median clean lap.

Before you load a race

Telemetry stays local

An optional .ibt file adds sectors, ideal lap, traffic and fuel per lap. Read locally, never uploaded.

Official races only

Races you can open under Results on iRacing.

Charts in the analysis

The same race again. Pick up to 3 rivals to compare — open the sample to hover the lines and read the numbers.
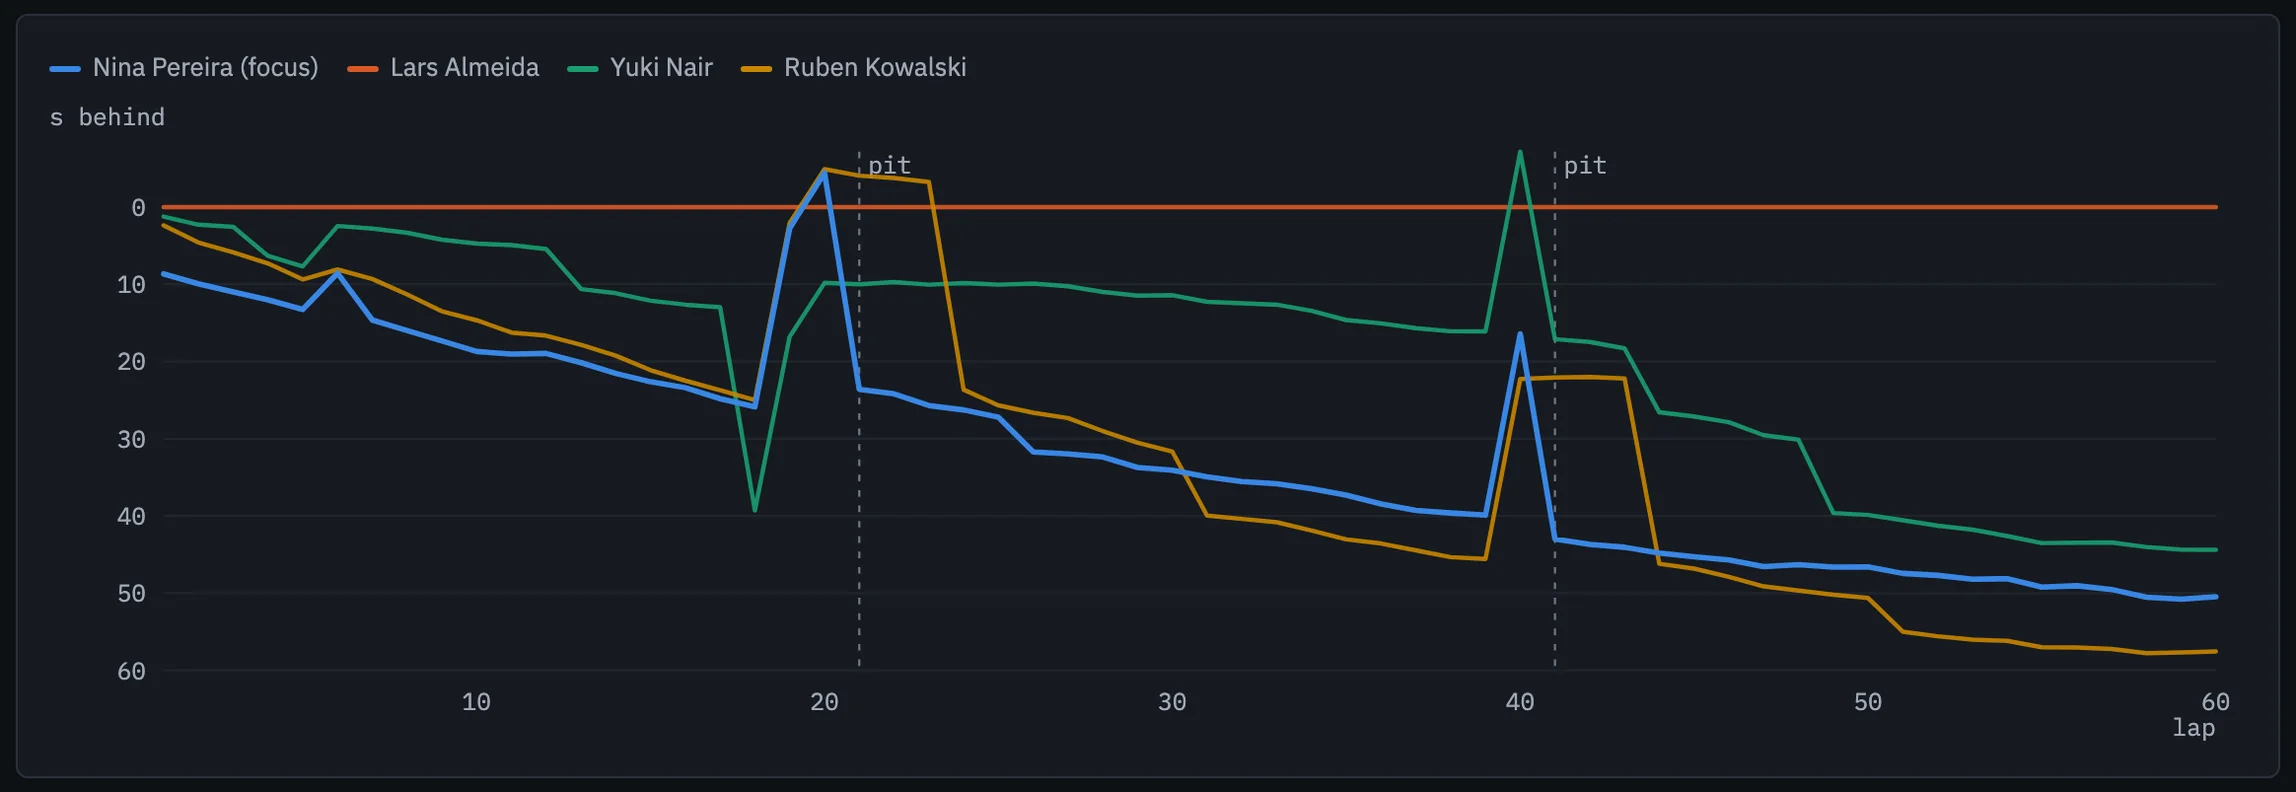
Race trace: gap to the class winner at the end of each lap for the focus car and three rivals over 60 laps, with both pit windows marked. The focus car loses about 25 seconds at each stop and takes most of it back over the stint that follows.
Race trace. Gap to the class winner at the end of each lap. The spikes are pit stops; what happens between them is pace.
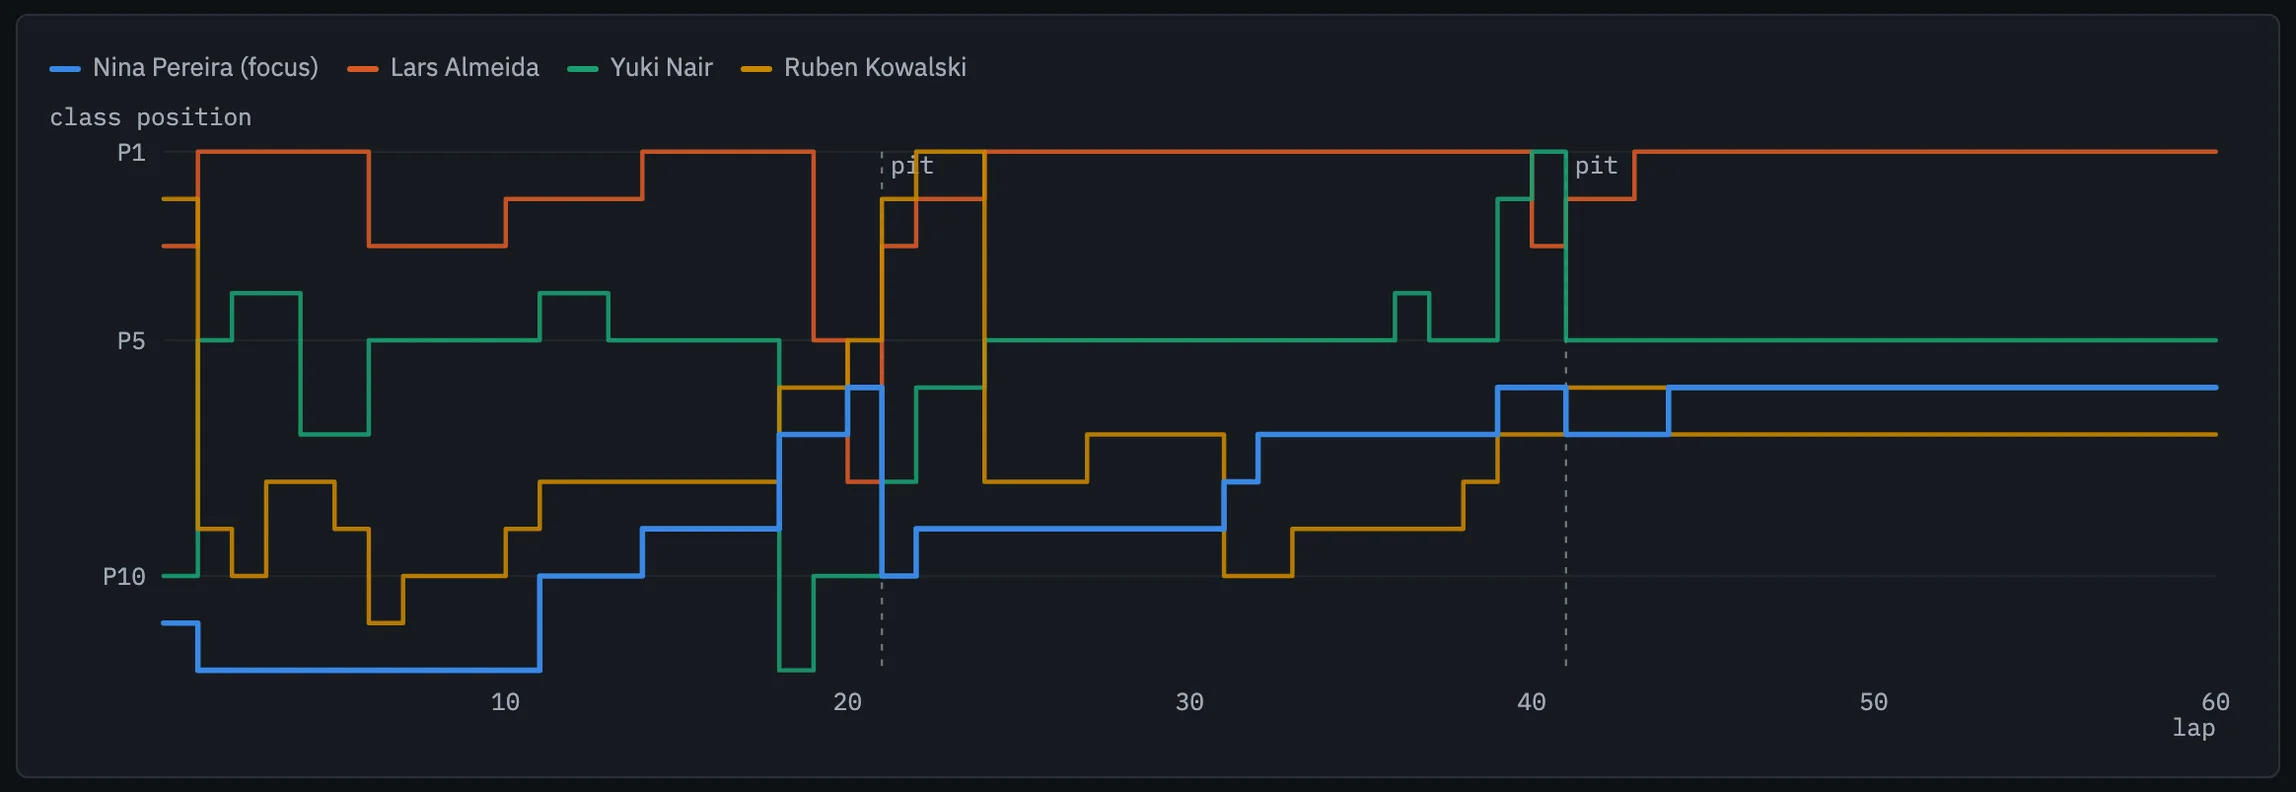
Positions chart: class position at the end of each lap for the focus car and three rivals, P1 at the top, over 60 laps, with both pit windows marked. The focus car climbs from P12 to P6.
Positions. Class position at the end of each lap.

Not affiliated with or endorsed by iRacing.

GapTrace
Load another race

On iRacing, open the race under Results and click Analyze race. It loads into this GapTrace tab and replaces what is on screen.

Setup and troubleshooting

Race trace

Key moments · numbered on the trace

    Positions

    Class position at the end of each lap. P1 at the top.

    Lap-by-lap pace

    Clean laps only: no pit lane, out lap, off track, contact or loss of control (events recorded by iRacing).

    Official results for your class. Click a header to sort. Tick a box to compare a car in the charts (up to 3); the tick takes that car's chart colour.

    Purple marks the fastest clean median in the class. Clean median = the median of that car's clean laps, meaning laps with no pit lane, out lap, off track, contact or loss of control. Pit loss = the time of the pit laps minus that many median laps, summed over every stop; it includes drive-throughs and repairs.

    More detail

    Pace by race phase

    Median clean lap in blocks of 20 laps. Δ is that car's block median minus yours, so a green + means you were quicker in that block and an orange − means they were.

    Class pure pace

    Your telemetry

    Drop your .ibt file from Documents/iRacing/telemetry. It's read in your browser and never uploaded.

    Every lap

    Every lap of the car you are analysing, from the official iRacing lap chart. Purple marks your best lap.